Vietnam’s H1 2026 Numbers: What They Mean for EU and German Supply Chains
- September 29, 2026
- Posted by: assistant
- Category: Uncategorized
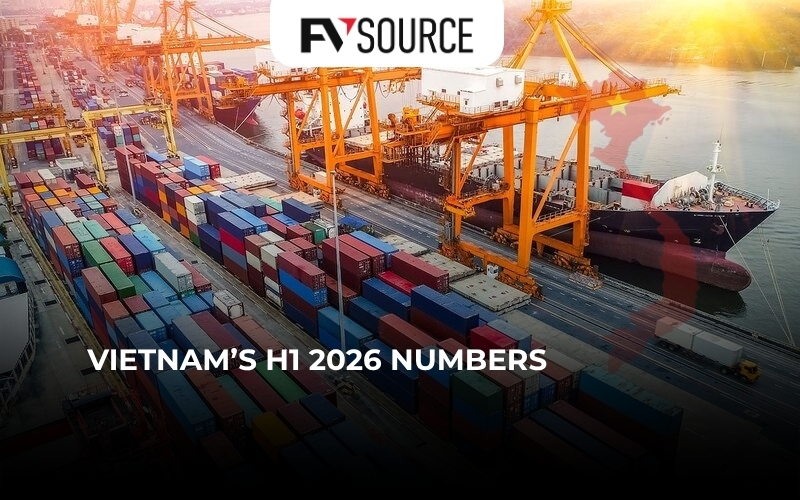
Vietnam is becoming more important in global production. But national growth figures do not qualify a supplier. The relevant question is whether your product can be produced reliably within the supply-chain architecture behind the factory.
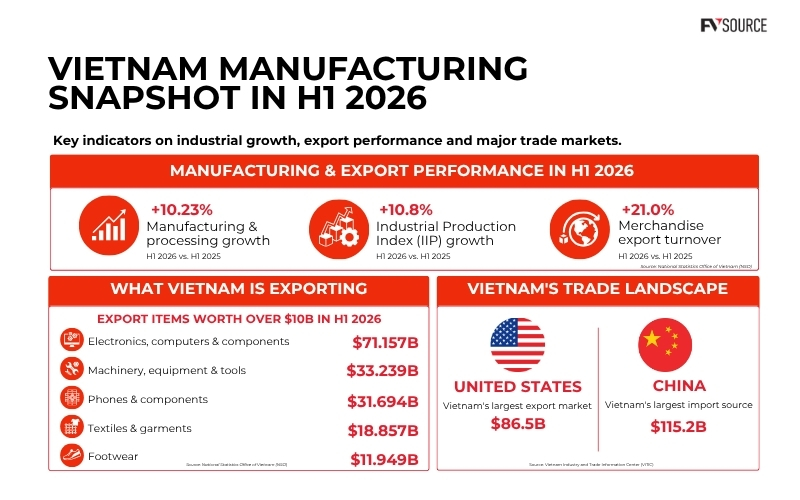
$266.5bn
Vietnam goods exports, H1 2026
79.9%
Share of exports from FDI sector
+10.8%
Industrial Production Index, YoY
Vietnam is already connected to the European market
Vietnam exported around US$31.8 billion of goods to the EU in H1 2026 – roughly 11.9% of total goods exports. European buyers are therefore not entering a new or untested export route. Vietnam already sits within established EU-facing production, logistics and commercial networks.
The EU-Vietnam Free Trade Agreement, in force since 1 August 2020, supports this relationship through preferential market access. But it should not be used as a shortcut for supplier assessment. Tariff preference depends on product-specific rules of origin and supporting documentation; it does not prove quality capability, traceability or delivery reliability.
Nor should the post-2020 increase in trade be attributed to EVFTA alone. It reflects overlapping forces: the recovery after the pandemic, global demand cycles, continued foreign investment, and broader sourcing diversification. EVFTA is an enabling condition, not a stand-alone explanation.
| Vietnam’s H1 2026 data does not mean that every product should move there. It does show that Vietnam has become a serious option for companies that define clearly what they want to localize, control and de-risk. |
FDI-led exports reveal both strength and a question for buyers
Foreign-invested enterprises accounted for US$213.0 billion, or 79.9%, of Vietnam’s H1 2026 goods exports. This demonstrates the country’s ability to host complex, export-oriented production and to meet the requirements of global customers.
It should not, however, be read as a measure of how much value is local: Vietnamese workers, subcontractors, logistics providers and suppliers are part of many FDI-led export chains.
The useful question for a buyer is more specific: how deep is the supplier ecosystem for our product? The answer can be very different for basic metal fabrication, furniture or garments than for precision components, electronics, specialized materials or complex assemblies.
For a buyer, the implication is practical: a strong national export number does not tell you how deep the supplier ecosystem is for your particular bill of materials. That depth varies substantially by sector, product complexity, location and the availability of qualified Tier 2 suppliers.
Imports illustrate the same point. Vietnam’s H1 2026 imports were US$283.2 billion, exceeding exports by about US$16.7 billion. Much of this reflects an expanding production base that imports electronics, components, materials, machinery and equipment.
It is important to distinguish two very different cases. Imported machinery, automation and test equipment can raise local productivity and quality capability. Imported critical inputs, by contrast, can create exposure where a component is single-sourced, subject to long replenishment times, or concentrated in one upstream geography.
The risk is therefore not “Vietnam imports a lot”. The risk is an unexamined dependency in your own bill of materials.
A practical lens: assess the architecture behind the factory
| Lower critical-input dependency | Higher critical-input dependency | |
| Higher factory capability | Preferred sourcing profile Validate quality, capacity and change control. | Strong factory, fragile upstream chain Build alternatives, buffers and escalation plans before ramp-up. |
| Lower factory capability | Local development opportunity Use pilots only where the learning curve and support effort are justified. | High-risk profile Do not infer readiness from price or available capacity. |
What a robust sourcing decision should test
A factory can be technically capable and still be commercially fragile. The decisive question is not whether it can make the part today, but whether its supply chain can keep making it when demand, specifications or upstream availability change.
• Critical BOM exposure. Identify the origin, lead time, substitute options and ownership of critical materials and components.
• Tier 2 concentration. Check whether a key process, coating, mould, component or material depends on a single upstream source.
• Engineering and change control. Confirm who owns tooling, drawings, test methods and approval rights when changes are required.
• Capacity under realistic demand. Verify not only installed capacity, but committed capacity, staffing, maintenance and peak-season constraints.
• Evidence for the EU market. Test the quality records, traceability and product-specific compliance documentation required for the actual product category.
• Scale-up governance. Define pilot gates, quality metrics, escalation paths and local follow-up before releasing volume.
Cost still matters. Total cost matters more.
In Q2 2026, the average monthly income of employees was close to VND 9.0 million, around VND 720,000 higher than a year earlier. The working-age unemployment rate was 2.22% in H1. This does not mean Vietnam has lost its cost advantage. It means that companies should avoid judging a project through labor cost alone.
A more realistic comparison includes yield and quality losses, engineering effort, logistics, inventory, supplier-development workload, compliance evidence and the cost of disruption. Vietnam can be highly competitive in that wider picture, but the outcome depends on the product and how the supplier relationship is set up and managed.
What this means for German companies
Vietnam is increasingly relevant for German companies in two connected ways. For buyers, it can offer a credible diversification and manufacturing option when the supplier-product fit is validated properly. For German industrial technology providers, the same manufacturing expansion can create demand for automation, process reliability, test and measurement, energy efficiency, maintenance and local technical support.
In both cases, the opportunity is not created by macro growth alone. It is created when the business model, local execution capability and supply-chain dependencies are understood in enough detail to make a controlled decision.
Conclusion
Vietnam’s H1 2026 figures are encouraging: production is expanding, EU trade links are established and industrial investment remains active. For many German and European SMEs, Vietnam deserves to be assessed as a serious sourcing and manufacturing option. But the data should lead companies to a more disciplined question than ‘Should we move to Vietnam?’
The better question is: which part of our value chain can Vietnam support, under what dependency profile, and with what level of supplier development and governance? Companies that answer that question before ramp-up are far better placed to turn Vietnam’s growth into resilient supply-chain value.
Sources and data notes
- Vietnam macroeconomic and trade data (H1 2026): National Statistics Office of Vietnam – Socio-economic performance in Q2 and H1 2026
- Vietnam–EU trade data (H1 2026): Vietnam News Agency / VietnamPlus – Free trade agreements give Vietnam’s exports powerful boost
- EVFTA status and agreement background: European Commission – EU–Viet Nam agreements
- Preferential rules of origin: European Commission Access2Markets – Preferential rules of origin
Data refer to H1 2026 unless otherwise stated. Trade values are rounded; the analysis and recommendations are FVSource’s own. All trade figures refer to goods trade and are stated in current US dollars. Partner-country trade data may differ between Vietnam Customs and Eurostat because of valuation, timing and statistical methodology. The two series should therefore not be combined in a single trend calculation without a clearly stated methodology.

About the author
Nguyen Thien Kim is Strategic Partner Germany at FVSource. With more than 20 years of experience across Germany and Vietnam, she supports European SMEs with feasibility assessment, supplier qualification, pilot production and the operational validation needed to build reliable manufacturing partnerships in Vietnam and Southeast Asia.

